


Interglacial layers

Fig.1: Intenal layers in the first 70 m of ice
Reflections from the inner layers of the ice sheet have played a very important role in glaciological exploration. Since the first RES observations were collected, a large number of reflections have appeared on radar-grams in the interval between the surface and the bedrock. They usually show a large variation in reflectivity, a high correlation with the main bedrock morphologies and less evidence towards the surface (Fig. 1) where bedrock conformations are completely lost. Many sources have been identified for these internal reflections: volcanic dust, variation in acidity, changes in the size or shape of air bubbles within the ice, variation in the orientation and density of ice crystals, paleo surfaces (such as crusts different from contiguous stratifications), layers of liquid water, etc. These layers are important because their continuity is assumed to represent a layer that was laid down in the same epoch of time, i.e. isochronous. The integrity of the layers makes it possible to follow the epoch and sometimes even the year of their formation. For example, notable eruptive events that have thrown enormous quantities of dust into the atmosphere, which is then found deposited in a layer, constitute a temporal 'marker' that can be placed on a precise date, such as the eruption of Vesuvius or Tambora. In other words, it is assumed that the arrival times of the most prominent internal reflections in the radar-gram represent stratification produced by a specific event, and that these layers producing more intense radar reflections are isochronous (Vaughan et al. 1999). Consequently, variations in snow thickness between these reference layers provide information on the variability of snow accumulation.
This kind of information is very important in many glaciological issues, like for example the assessment of an ice-drill location (at the same depth, sites where snow accumulation is less, correspond to older deposits). In this context, RES and GPR surveys have been used to investigate the same area at different scale resolutions. RES is mainly used to provide information about the main layer distribution over great distances and depths neglecting shallow small scale details (like wind driven redistribution). On the contrary, GPR is mainly used to analyze the problem of ice-atmosphere interaction in superficial snow redistributions (mega-dune areas, erosion and accumulation driven by surface morphology and prevalent wind direction along the maximum slope direction). In figure 4 a GPR radargram (antenna frequency 200 MHz, investigated depth 70 m) is reported. It shows a very high variation in snow accumulation over relatively short distances due to ice-atmosphere interaction.
Ice depth and bedrock elevation
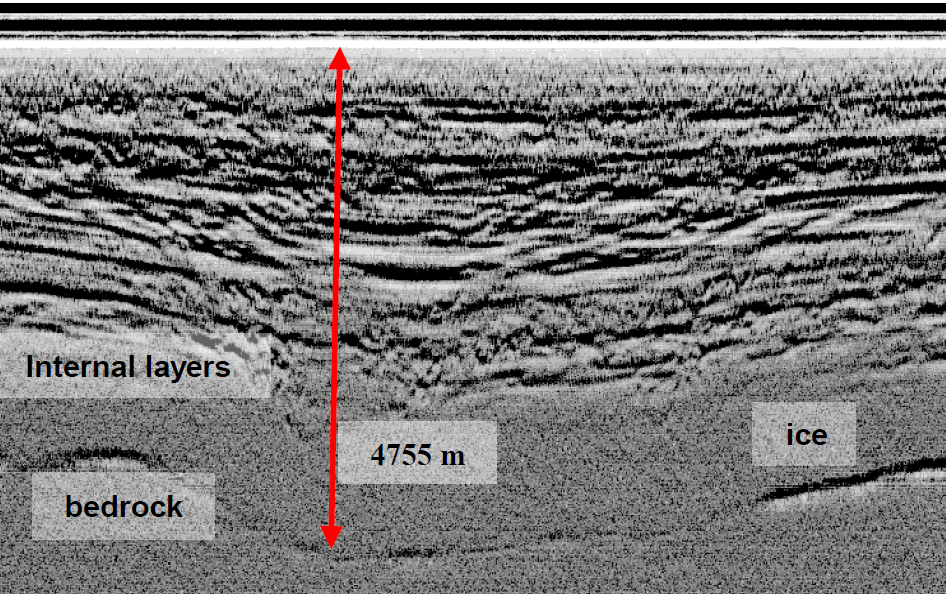
Fig.1: Deepest ice point in Antarctica
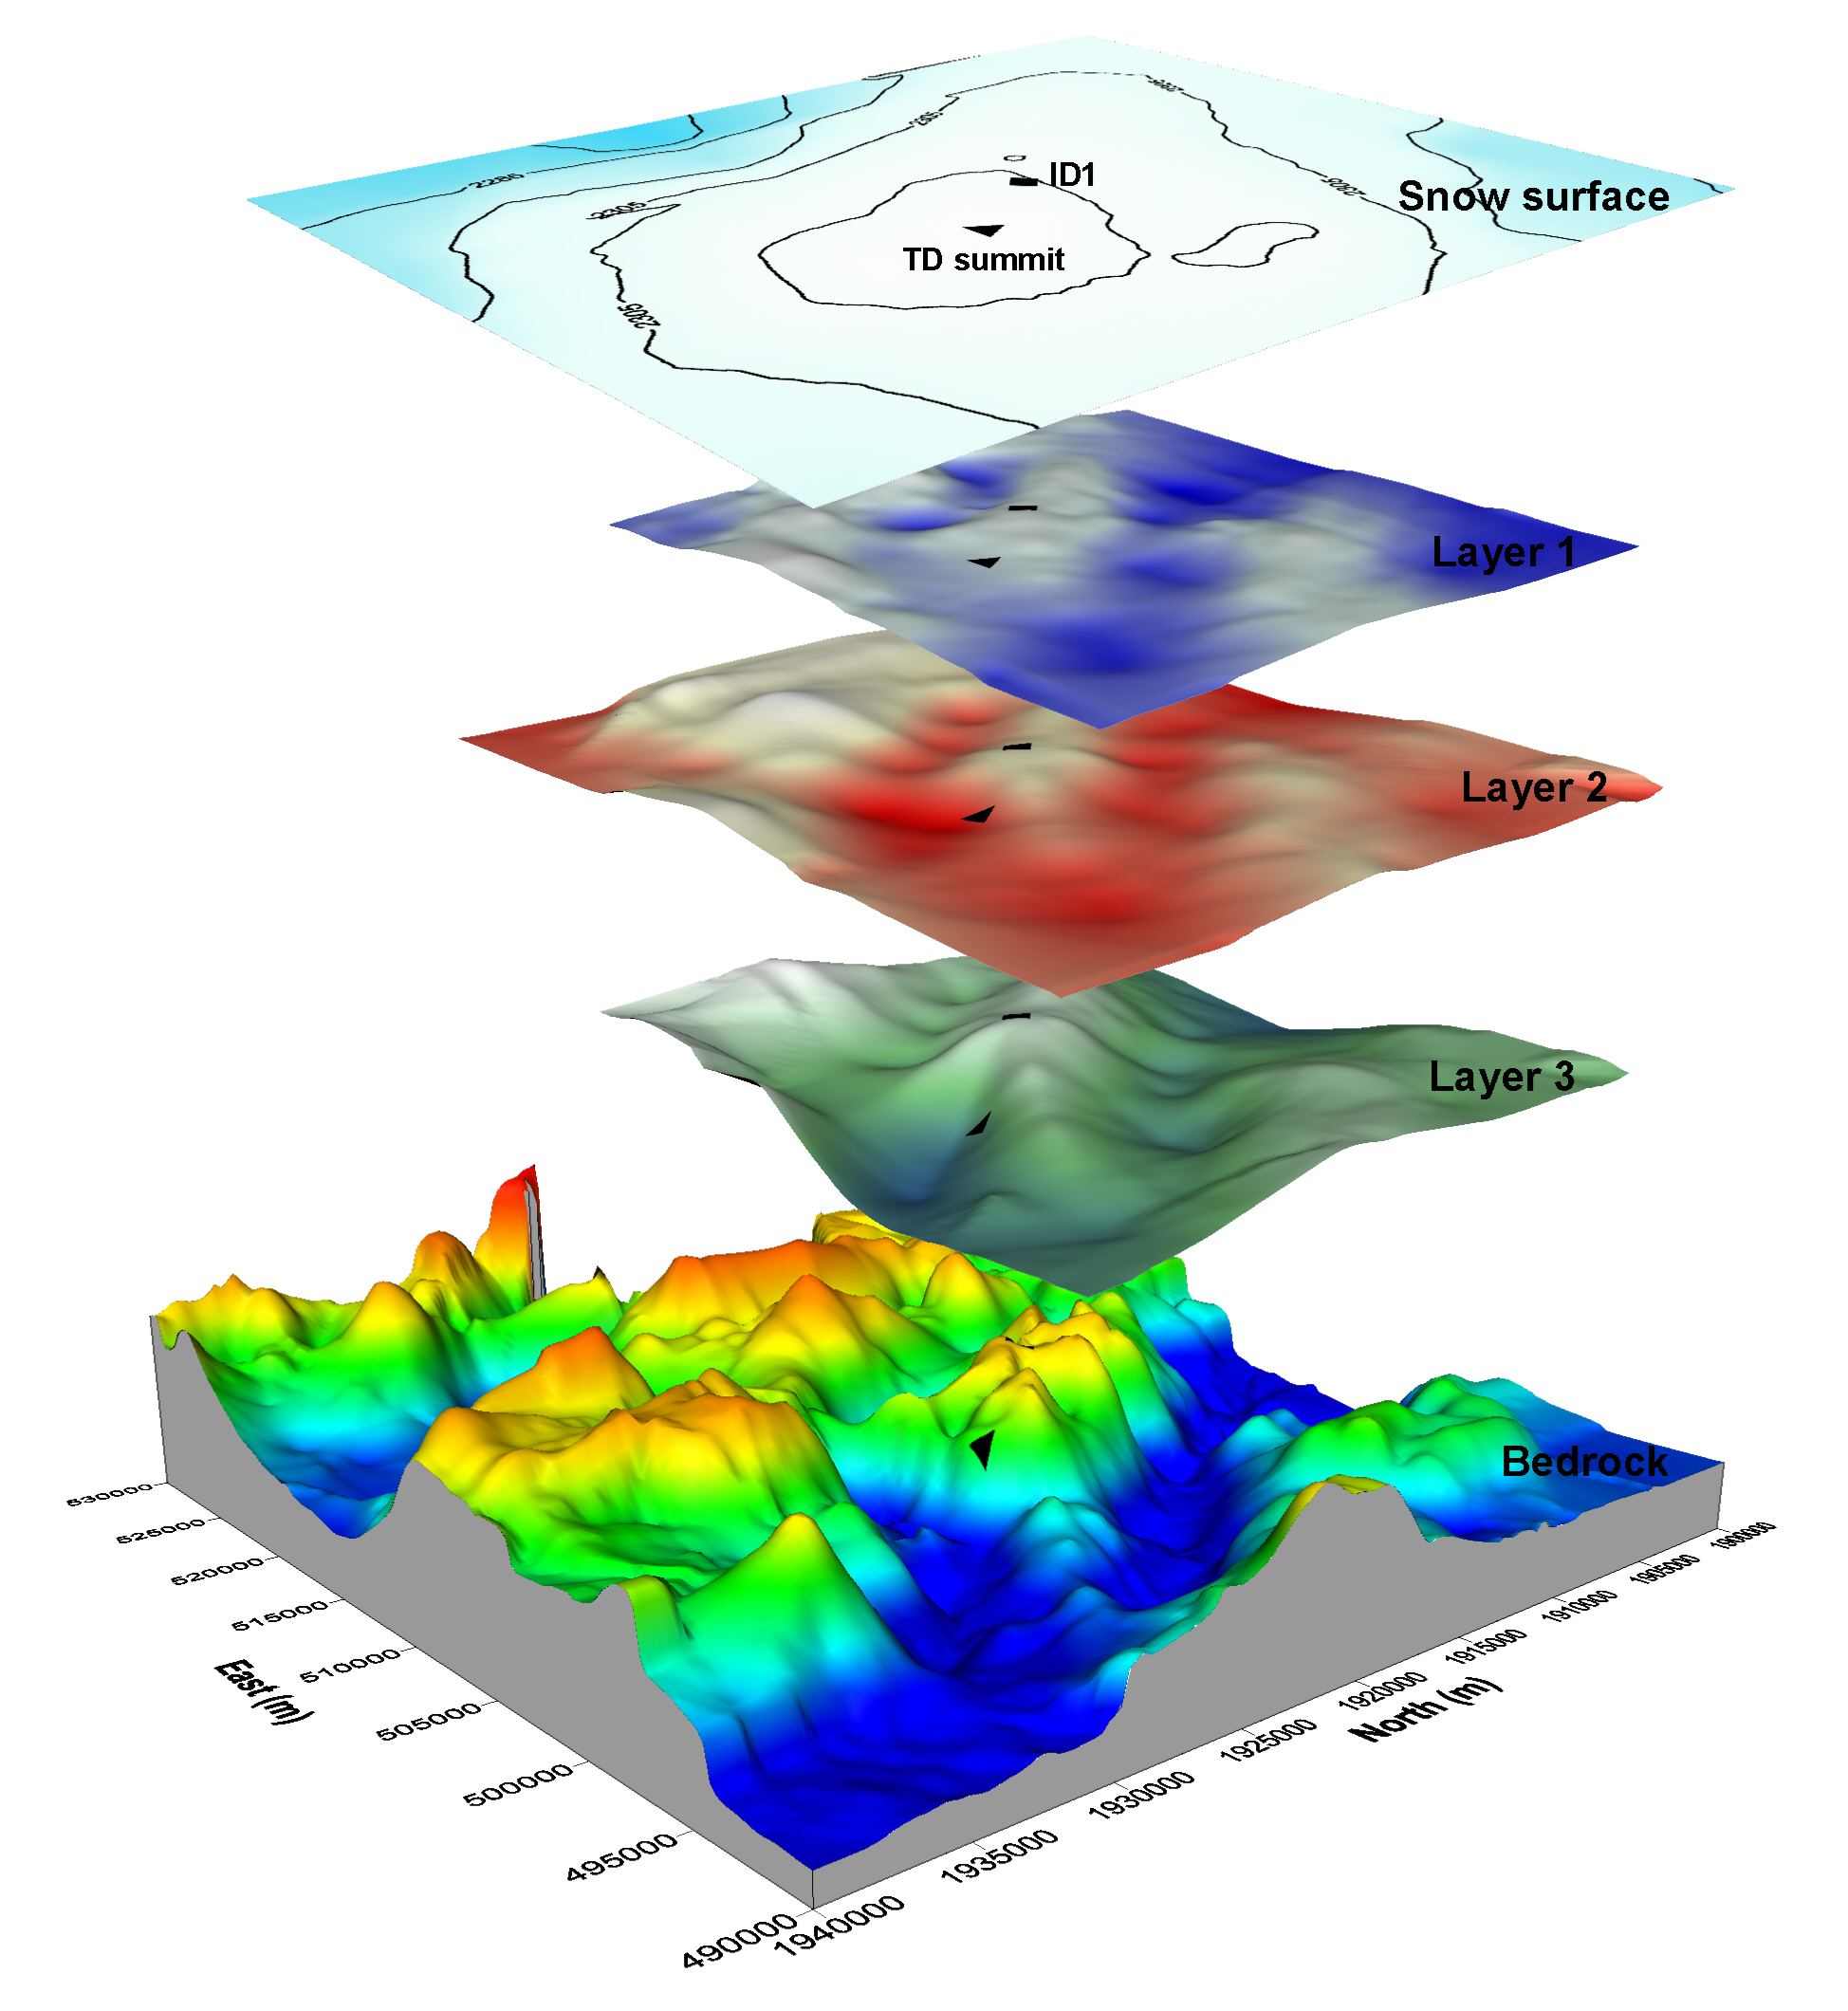
Fig.2: Talos dome ice layers and drilling point
The measurement of ice thickness is the most widespread application of radar systems (Fig. 1). Most of these radar data have been collected, in different survey areas, by the National Science Foundation NSF of the USA, the Scott Polar Research Institute, UK (SPRI), the British Antarctic Survey, the Alfred Wegener Institute, Germany, the Technical University of Denmark (TUD) and, in recent years, the Italian Programma Nazionale di Ricerche in Antarctica (PNRA). RES measurements have been widely used to study the grounding line (the point at which continental ice, flowing towards the open sea, begins to float) of many Antarctic outlet glaciers. From the shape of this glacier outlet port, with the measurement of ice velocity, it is possible to estimate the flow, i.e. the amount of ice flowing into the sea per second. This estimate over all glaciers in an area of the ice sheet plays an important role in calculating the total mass balance of the Antarctic ice sheet, an important indicator of climate change.
Another important and indispensable application of RES measurements is the selection of the ice core drilling site. In recent years, ice core drilling in the thickest areas of the ice caps has enabled the reconstruction of about 1 million years of our planet's climate history (EPICA project at Concordia Station). From the ice cores, it is possible to analyse the air content trapped in ice from hundreds of thousands of years ago. This analysis has clearly revealed how human activities have increased the amount of greenhouse gases over the years and how this has influenced the recent climate. Accurate information from RES systems on the depth of the rock substrate, topography and internal layering behaviour is as important as surface topography and ice flow velocity in choosing the best drilling location (Fig. 2).
Many of these surveys have been organised by the Italian glaciology radar group in various measurement campaigns in Italy and Antarctica as part of different research projects.
Measurement technique
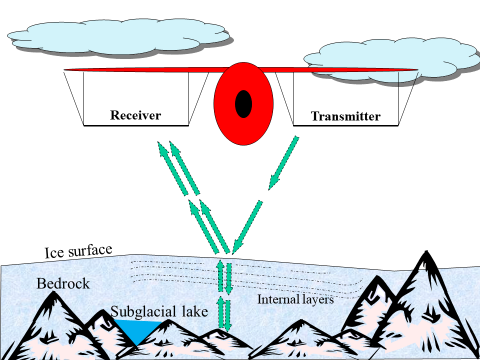
Fig.1: Electromagnetic signal path trasmitted by RADAR
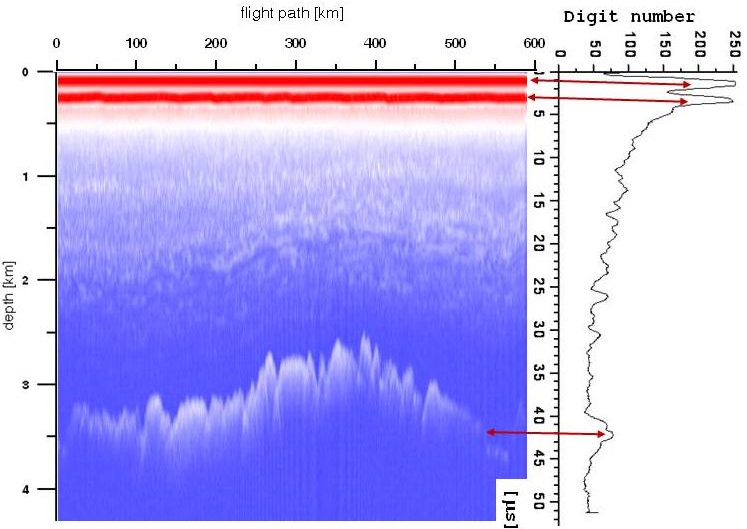
Fig.2: Correlation beetween radar trace (on the rigth) and radargramm (on the left)
The first indication that high-frequency radio signals can penetrate snow and ice was observed at Admiral Byrd's base, Little America (Antarctica) in 1933. Pilots reported that radar altimeters were measuring incorrect values on the ice and the US Army launched an investigation that discovered that ice and snow are transparent to VHF and UHF band electromagnetic radiation (see Fig. 1). Later in 1957, Waite and Schmidt demonstrated that a radar altimeter could be used to measure the thickness of polar glaciers (Waite and Schmidt, 1961). In 1963, the first VHF radar system specifically for radio soundings was developed at the Scott Polar Research Institute (SPRI) at Cambridge University, and various scientific institutions subsequently carried out measurements in the Arctic and Antarctic with this technique that is still in use today.
The first RES survey systems implemented short-pulse envelope radars operating from 30 MHZ to 150 MHz and were used in Greenland and Antarctica. The acquired radar track was displayed on an oscilloscope. The received radar track shown on the right of Fig. 2 is still referred to as the 'O-scope' from 'oscilloscope' while the radargram on the left is a colour map of the track amplitude. The recording system consisted of a 35 mm motorised camera with adjustable film speed, synchronised with the speed of the aircraft. Position determination was initially achieved by the observation of recognisable landmarks by the system operator and later by inertial navigation systems using motion-sensing devices.
Technological improvements have made these RES systems much more powerful. Today, the digital acquisition of radar tracks allows more tracks to be recorded in fast digital mass storage devices, enabling surveys over large areas with better horizontal resolution. Numerical processing of the acquired tracks significantly improves the dynamics and signal-to-noise ratio. In addition, differential GPS measurements make it possible to accurately determine the geographical position of the acquired tracks, reducing uncertainties to ±5 m and ±10 cm in post-processing.